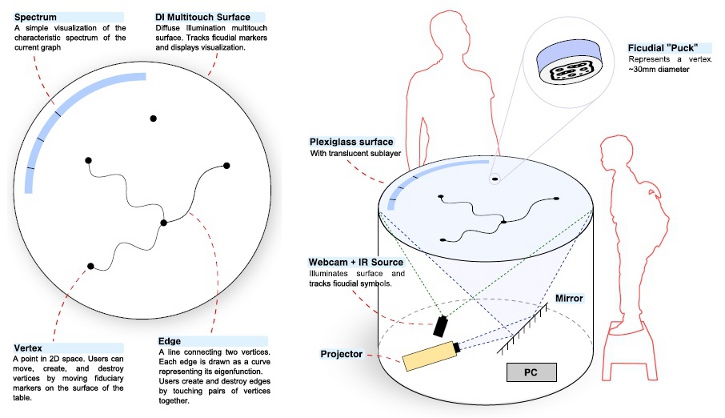
Every year the Royal Society opens its doors to the public for the Summer Science Exhibition. For their 2010 exhibition, I worked alongside the maths department at the University of Bristol to build a DI multitouch surface, illustrating recent work on quantum graphs and isospectrality.
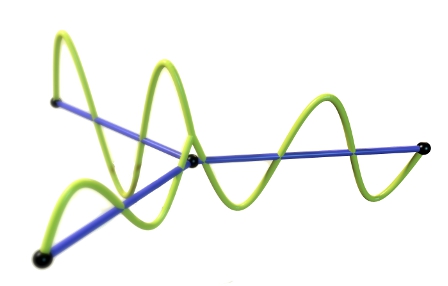
A graph is a set of points (black spheres), joined together by (blue) lines. A graph is said to be “metric” when we care about the length of the lines. Examples of things that can be thought of as graphs: the London Underground, spiderwebs, the internet, graphene, etc.
What happens if we made a graph out of bits of string, and then pluck it like a guitar, or bow it like a violin? The graph is going to vibrate in some characteristic way (green lines). It will also probably make a sound - a note, or perhaps a chord. This is what’s called a “quantum” graph - a metric graph with some associated rules about wavelike behaviour. It turns out that every possible graph has a discrete set of associated vibrational frequencies - that is, a characteristic sound. The list of frequencies, or pure tones, which make up this sound is called the “spectrum” of the graph.
It’s interesting (to me) that while it is easy to work out the sound of the graph from its shape, it is hard to work out the shape of the graph, given only the sound. Quantum graphs have applications in chemistry, quantum mechanics, photonics, human physiology, engineering, etc.
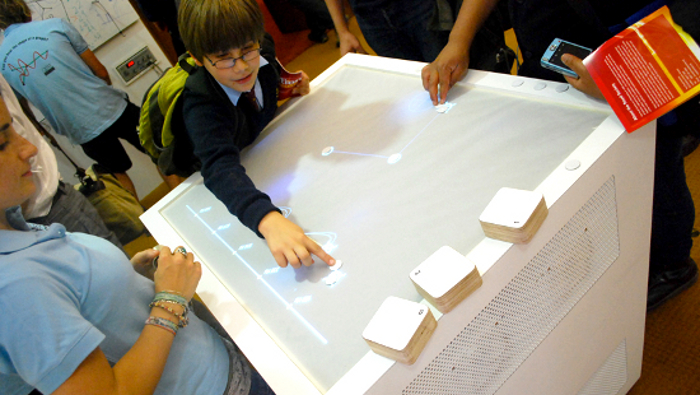
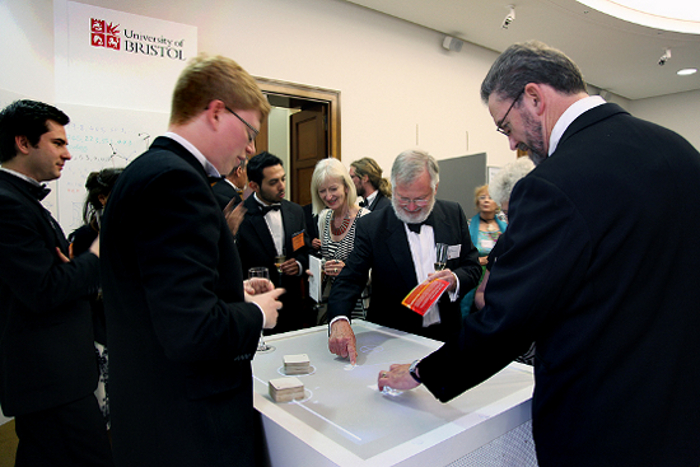
The demographic of visitors to the Royal Society exhibition is very broad: from primary school children to Nobel laureates, and everything in between. We set ourselves the goal of taking real simulations that are routinely performed by PhD students and postdocs from the Maths department, and making them interactive - in such a way that they are accessible, clear, and interesting to literally everyone. In particular we did not want to dumb down the maths - the mathematical framework inside the exhibit is exactly the same as that used for cutting-edge academic research.
The exhibit needed to be
- Anarchic fun for young children
- Interesting and accessible for secondary school students
- Challenging and suprising to academics
- Physically robust to the destructive efforts of children and drunk professors
We built a DI multitouch surface, running custom software which allows users to create graphs, visualize eigenfunctions and spectra, and hear the characteristic sound of each graph. The table supports multiple users simultaneously. It is doing the following:
- Real-time tracking of fiducial markers and graph vertices: A modified webcam and a diffuse source of infrared light are used to recognise and track objects placed on the surface of the table. Placing a coin-sized marker on the surface creates a vertex. Vertices may then be joined together to create graphs, using natural gestures. Suprisingly, it works in daylight.
- Real maths: The behaviour of the current graph is calculated in real-time by a fast quantum graph solver. This computes the spectra and eigenfunctions of any graphs currently on the table.
- Visualization: The motions of the “strings” connecting the graph together (the eigenfunctions of the graph) are calculated and projected onto the surface using a short-throw projector, mounted inside the table.
- Real-time audio synthesis The spectrum of each graph on the table is converted to sound using a custom digital synthesizer and a loudspeaker. This allows users to experiment with simple ideas such as the harmonics of a single string, as well as more complex problems, for instance isospectrality.
- Controls: Special fiducial markers are used to control software parameters such as eigenfunction order and volume.
The wooden box was built by Design Rock. Great ideas came from many good people in the Maths department. Software was written by me, except for most of the tracking code, which came courtesy of reacTIVision. Optics, cooling, power, electronics by me. Graph solver by Ram Band et al, ported to Python by me. Audio synthesis written in ChucK. Everything else in Python.
Press
Guardian
Marcus du Sautoy
Financial Times
New Scientist
physorg