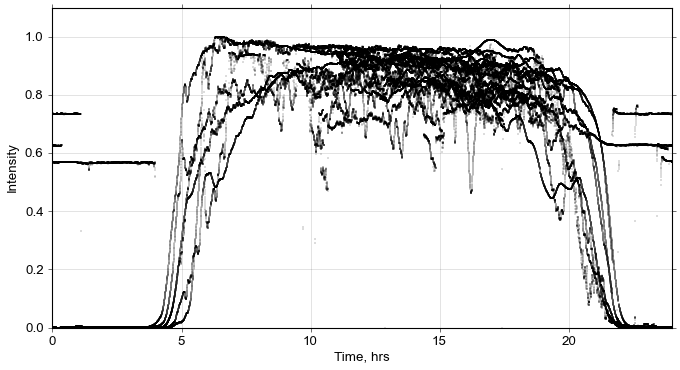
I made a light sensor using an LDR and an Arduino, and left it on my desk for a few weeks. This graph shows light intensity as a function of the time of day.
You can see features corresponding to day and night, clouds crossing the sky, and the fluorescent bulbs in our office. The increase in high-frequency terms around 10:00 marks the arrival of other people in the office, moving around and casting shadows. On the left hand side of the plot you can see a night when I worked until 4 A.M.